
This page in brief
Climate change science predicts that the earth will heat up over the next century. So far the predictions are correct, with record temperatures being experienced over the past two years and the past 20 years.
Global temperatures
It isn’t easy to calculate average global temperature. Which measurements should be included, and how much should each be weighted? Do we want air temperature, or water temperature?
Different calculations therefore do not always agree totally. But the picture is quite clear.
Global temperatures are rising …. fast
This graph from NASA shows how much global average temperature has risen since accurate measurements are available. The temperatures are expressed as the difference from the average temperature in the 1951-1980 period.
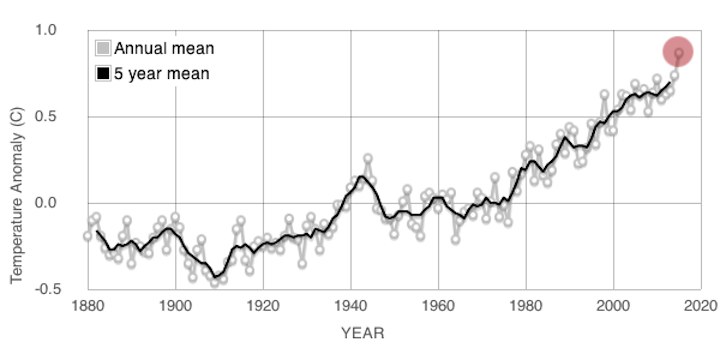
The graph shows that:
- Average global temperature has risen about 0.7 degrees Celsius in the past few decades, and 1 degree in the past 130 years.
- There is plenty of variability about the longer term trend. For example, between 1940 and 1975, the average temperature dropped slightly, only for rising temperatures to resume over the next quarter century.
- The last decade has been the hottest on record. The rate of temperature rise did slow down for a while at the start of the 21st century, but has since speeded up again.
- The last two years (2014, 2015) have been the hottest ever recorded.
Climate scientists have used tree rings and ice cores to estimate global temperatures for the past 2000 years (Wikipedia), and have found that the temperature has virtually never been above the 1951-1980 average over that time. What we are experiencing is hotter temperatures than have been known for at least two millennia, and probably far longer.
Misleading claims
No longer rising?
Not so long ago, some people were claiming that temperatures were no longer rising, and the hottest year on record was a decade ago (in 1998). This was not correct, as 2005 was hotter than 1998. It was true that the period 2002-2012 saw very little increase in temperature, but this was a flat section of an otherwise rising curve, and didn’t change the long term trend. The “flat spot” in temperatures between 1940 and 1975 was far longer than this recent period, but did not indicate any change in the long term trend.
A slow-down?
Another claim was that the slower rate of rise in temperature over the period 1998-2012 indicated that warming was slowing down, and the scientific predictions were wrong. However this claim misrepresented the evidence. Climate change science predicts both a long term rise in temperature with hotter and colder periods leading to variations about this trend. These variations occur for reasons that are broadly understood, especially the El Nino and La Nina weather patterns. The temperature graph shows evidence of all this.
Facts – the antidote to misleading claims
These are the facts on worldwide average temperatures (from Wikipedia):
- The hottest year on record occurred in 2015, with 2014 second and 2010 third.
- 15 of the hottest 16 years on record occurred since 2000.
- 2015 was not only the warmest year on record, it broke the record by the largest margin ever, and was the 39th consecutive year with above-average temperatures.
- Long term trends are more important than individual years, and the continuing upward trend is clear.
- The long term rate of change in world temperature is faster than any previous change.
It cannot be doubted
The world is warming, at an unprecedented rate, and is hotter than it has been for a long time. This cannot be doubted by anyone who looks at the evidence.
Next
Photo: MorgueFile. Graph: NASA.
Feedback on this page
Comment on this topic or leave a note on the Guest book to let me know you’ve visited.